The Federal Reserve’s Non-Cash Payment Study: Insights from 2018 to 2021
- Between 2018 and 2021, non-cash payments experienced a growth rate of 9.5% per year, outpacing previous measurement periods by double the growth rate, reaching $128.5 trillion.
- The largest growth came from ACH transfers, accounting for 90% in value over the period and expanding to $91.9 trillion.
- Checks saw an increase in their average value, rising from $1,908 to $2,430 during this timeframe; however, there was a general decrease of 7.2% in the number of checks issued, totaling 11 billion items.
- Card payments grew by 10% annually and now make up 7% of non-cash transactions. Prepaid cards saw even faster growth at 20.6% per year but account for only 6.5% of all card payments.
- Debit cards dominated in card payments, representing 56% of all such transactions with a volume of 51.1 billion items.
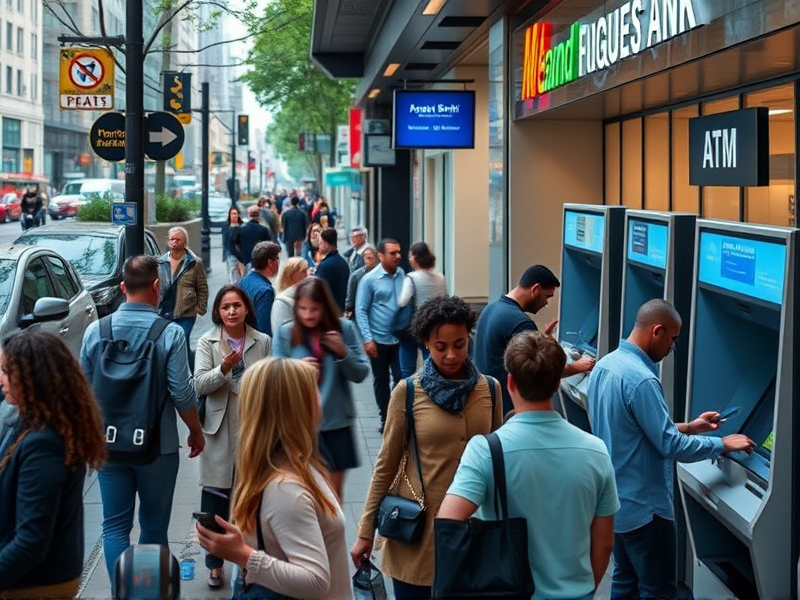
- The frequency of ATM use declined by 10.1% annually, though the average withdrawal amount increased from $156 to $198 by 2021.
- Private Label Cards faced significant decline; debit transactions decreased from 5.5 billion units in 2018 to 5.1 billion in 2021, while credit card transactions dropped from 3.8 billion units to 3.3 billion during the same period.
Key Observations:
- The acceleration of clearances via ACH growth suggests a shift towards faster payment systems with FedNow and Real-Time Payments (RTP) playing pivotal roles in this transition.
- While checks are declining, they remain a resilient part of the payments landscape; businesses and consumers will continue to use them for various reasons.
- The reduction in ATM usage underscores broader acceptance of digital payment methods, reducing reliance on cash altogether in many scenarios.
- The decline of Private Label Credit Cards (PLCC) is linked to maturation of buy now, pay later services as highlighted by recent research from Javelin Strategy & Research.